
Data

Welcome to the Office of Inclusive Excellence Dashboard! Institutional data and results from the various evaluations conducted by OIE are available here.
Please click one of the tabs to see the respective data visualization. The first tab ("Files and Reports") contains links to various documents and resources created by OIE.
For general institutional research and data about the UC Irvine campus, please visit the Office of Institutional Research Data Hub.
For general information and data about the UC system (including the UC Irvine campuses), please visit the UC Information Center. Results for the UC Undergraduate Experience Survey (UCUES) are available on their UCUES page, and results for the UC Graduate Student Experience Survey (UCGSES) are available on their UCGSES page.
Note: These visualizations are designed to be viewed from a desktop or laptop computer and may not display properly when viewed from other devices. If a visualization is not displaying properly, try refreshing the page.
Visualizations:
UCI Demographic Charts 2021-22
UCI Demographic Charts 2022-23
UCI Demographic Charts 2023-24
UCI Demographic Charts 2024-25
UCI Demographic Charts 2025-26
Reports:
2022 Community Safety Survey Report
Research Brown Bags:
An Overview of Collecting Campus Climate Data (PDF)
An Overview of Collecting Campus Climate Data (PPT with notes)
Implicit Bias and Research Examples (PDF)
Implicit Bias and Research Examples (PPT with notes)
This visualization displays basic demographics for the UCI community of students, faculty, and staff. These demographics can be viewed for various groups by selecting the Year and Area from the drop-down menus to the right. The Overview tab contains information related to gender identity and URM status for the UCI population, while the Effectors tab contains information related to effectors of opportunity (first-generation, low-income, and URM status) among undergraduate students. For the list of data definitions used in this visualization, please click the button below the visualization.

Gender reflects the individual’s self-reported gender identity as one of four categories: women, men, nonbinary, and those who did not provide gender identity information.
Underrepresented minority (URM) status is displayed as one of three categories: URM, Non-URM, and International. Individuals are considered domestic if they are US citizens, permanent residents, amnesty recipients, approved petitioners for immigrant visas, refugees, or political/religious asylees. All individuals without domestic status are considered International. “URM” refers to domestic individuals who identify as: American Indian or Alaskan Native, Black or African American, Hispanic or Latinx, or Native Hawaiian or Pacific Islander. “Non-URM” refers to domestic individuals who do not identify as any of the ethnic groups considered URMs.
Effectors of opportunity are demographic characteristics which have been shown to have an effect on academic performance due to systemic inequities. At UC Irvine, this includes first-generation, low-income, and URM students. First-generation students are students with no parent or guardian who has completed a bachelor's degree or higher. Low-income students are students with application fee waivers and/or eligibility for the Educational Opportunity Program.
Undergraduates and graduate students are all students of their respective level who were registered at UCI as of the end of the third full week of classes for the Fall academic term of the given year. Undergraduates include all Baccalaureate students, and Graduate Students include all Masters, Doctoral, and Professional Doctoral students.
Senate faculty are faculty members with membership in the UCI Academic Senate, which primarily includes ladder-rank Assistant, Associate, and Full Professors.
Staff are defined as all full-time, non-student UCI employees who are not teaching faculty (e.g., professors and lecturers). This includes all non-teaching Academic Staff (e.g., librarians and research professionals), as well as all Professional & Support Staff, Managers, and Administrators.
STEM stands for “Science, Technology, Engineering, and Mathematics” which are related fields often examined and discussed together in educational policy. STEM Schools at UCI include: Biological Sciences, Engineering, ICS, and Physical Sciences. Non-STEM Schools at UCI include: Arts, Business, Education, Humanities, Law, Medicine, Nursing Science, Pharmacy, Public Health, Social Ecology, and Social Sciences.
The Health Sciences category includes aggregate data for Medicine, Nursing Science, Pharmacy, Public Health, which are collectively referred to as the College of Health Sciences.
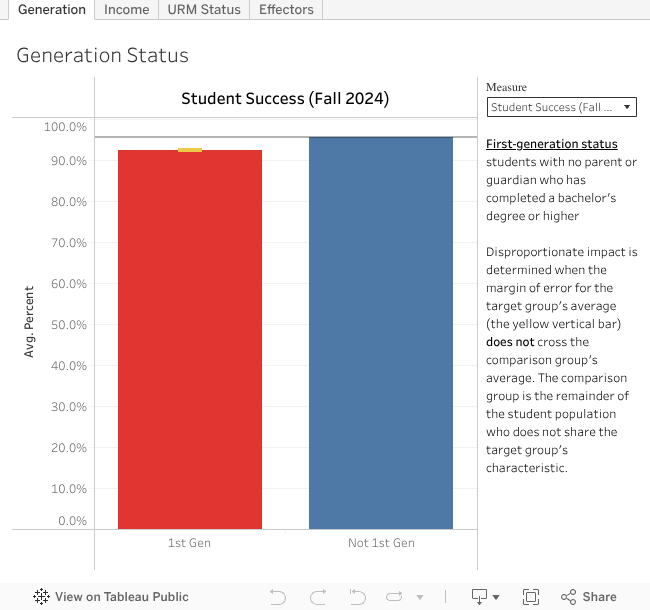
The visualization below provides information about equity gaps as they appear in undergraduate student outcomes related to retention, graduation, and success rates. The retention rate refers to the percentage of students from a given Fall quarter who continued to enroll at UC Irvine in the following Fall quarter. The graduation rate refers to the percentage of students within a given cohort year who graduated by the end of their 4th year after being initially enrolled. The success rate refers to the percentage of successful outcomes (i.e., passing grades) among all attempted courses in the given undergraduate student population.
This information is presented according to effectors of opportunity, described by a UC Santa Barbara study as “manifestations of systemic inequities that have been shown to have an effect on academic performances.” For the following UC Irvine data, this includes first-generation, low-income, and underrepresented minority (URM) students. These categories also coincide with the groups listed in the University of California’s UC 2030 goals to eliminate disparities in student success. (See the “UC Equity & Success Goals” tab above for the related visualization.)
While group differences may be expected, disproportionate impact (DI) refers to demographic groups experiencing noticeably different outcomes due to their group’s identity characteristics. In the visualization below, DI is calculated according to the percentage-point gap method established by the California Community College Chancellor’s Office as the single standard method for measuring DI among their institutions’ student populations. Using this method, DI is defined as any comparison group difference that exceeds the margin of error for the target group’s average. This is depicted in the visualization by whether the yellow vertical bar crosses the horizontal black line. Group averages are colored red if DI is present according to this method.
Use the tabs at the top of the visualization to see rates based on generation, income, URM status, or a combination of these effectors. Use the dropdown menu to the right of the visualization to see rates for retention, graduation, and course success. Hovering over the yellow vertical bar gives detailed information about the size of the gap, the margin of error, the presence of DI, and the number of successful outcomes for the target group that would have been required to close the gap.
The visualization below reflects UC Irvine's data for equity and student success goals as part of the larger systemwide UC 2030 framework. The University of California has set goals to eliminate disparities for low-income (Pell recipient), first-generation, and underrepresented students. Use the dropdown menu on the right side of the visualization to see specific data for any of these student groups at UC Irvine.
The Home tab below provides an overview of the UC 2030 framework and its goals, as well as 4-year graduation rates and trends.
The Goals tab provides detailed information about UC Irvine's graduation rate goals and current requirements for achieving these.
The Progress tab provides information about retention rates and how these are connected to graduation rates.
The Learn More tab provides additional information and documents related to the UC 2030 goals.
Note: The information below comes from the University of California Office of the President and uses its data definitions and counting rules.
The visualization below provides information about undergraduate student enrollment in terms of the school they enrolled in during their first year and their achieved outcome after their fourth year. This information is provided as a cumulative overview of enrollment outcomes for all 4-year cohorts between 2016-17 and 2021-22, with the most recently completed cohort's data added each year.
The Outcomes tab provides summary information about these enrollment outcomes. Use the School dropdown menu to see results according to students who enrolled in the given school during their first year. The various outcomes include whether students graduated from the given school or a different school within four years, were enrolled in the given school or a different school after four years, or were no longer enrolled at UC Irvine as of the end of their fourth year. This information is also displayed according to effectors of opportunity (URM, first-generation, and low-income statuses) in each column.
The Pathways tab provides a visual representation of students' various patterns of enrollment. The yellow vertical bars represent enrollment status as of Year 1, Year 2, Year 3, and the end of Year 4. Hover over the bars to see the number and percentage of students represented at the given timepoint. The ribbons between each bar represent the pathways students have taken between each year of enrollment and the outcome as of the fourth year. Hover over a ribbon to see the number of students who have taken that specific path to the given outcome.
Select a School from the dropdown menu to see results for students who were enrolled during their first year. Select a Population to see patterns enrollment for all students or only those who have a given effector of opportunity. Select an Outcome to Trace to highlight all pathways leading to the given result at the end of students' fourth year of enrollment.
The pathway visualization was adapted from templates provided by Ken Flerlage. Please be advised the pathways may take some additional time to calculate and display on slower machines or devices.

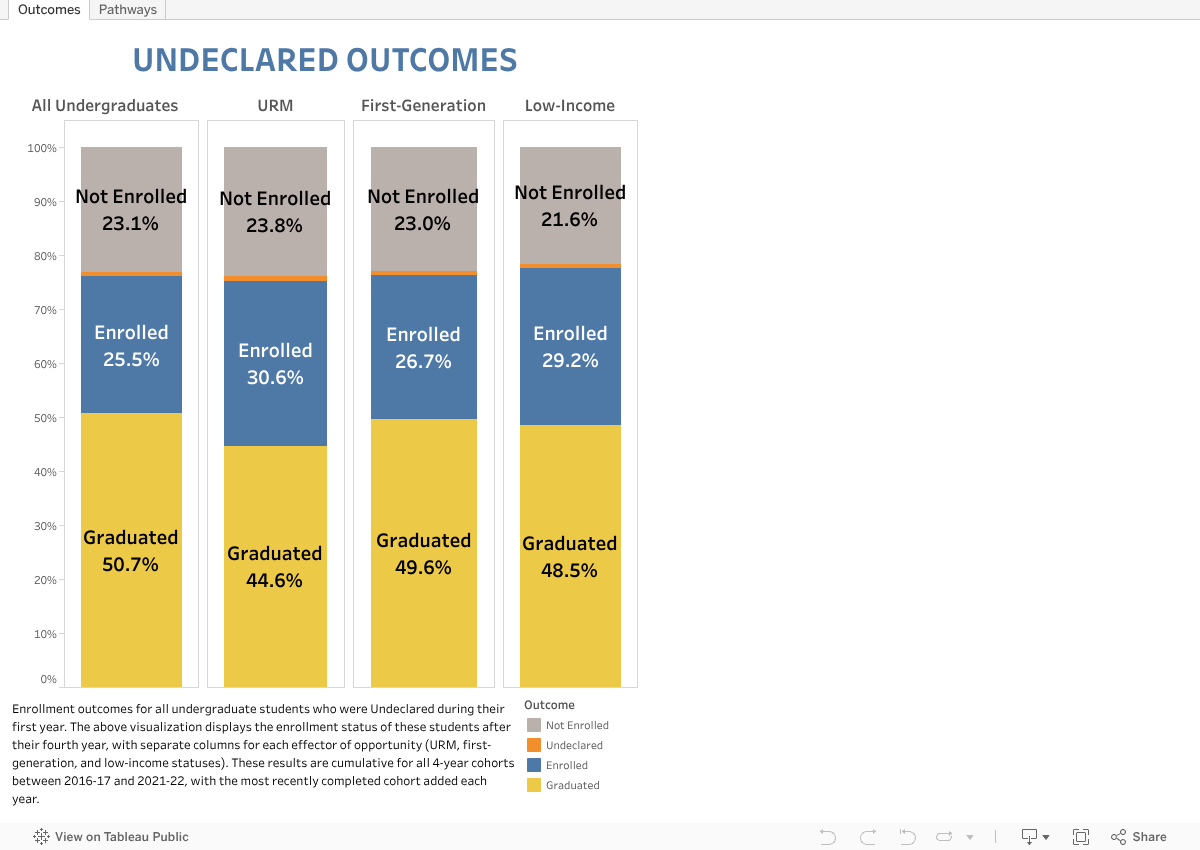
The visualization below provides information about undergraduate student enrollment for students who were undeclared during their first year in terms of what outcome they achieved after their fourth year. This information is provided as a cumulative overview of enrollment outcomes for all 4-year cohorts between 2016-17 and 2021-22, with the most recently completed cohort's data added each year.
The Outcomes tab provides summary information about these enrollment outcomes. The various outcomes include whether students graduated from a given school within four years, remained enrolled in a given school after four years, or were no longer enrolled at UC Irvine as of the end of their fourth year. This information is also displayed according to effectors of opportunity (URM, first-generation, and low-income statuses) in each column.
The Pathways tab provides a visual representation of students' various patterns of enrollment. The yellow vertical bars represent enrollment status as of Year 1, Year 2, Year 3, and the end of Year 4. Hover over the bars to see the number and percentage of students represented at the given timepoint. The ribbons between each bar represent the pathways students have taken between each year of enrollment and the outcome as of the fourth year. Hover over a ribbon to see the number of students who have taken that specific path to the given outcome.
Select a Population to see patterns enrollment for all undeclared students or only those who have a given effector of opportunity. Select an Outcome to Trace to highlight all pathways leading to the given result at the end of students' fourth year of enrollment.
The pathway visualization was adapted from templates provided by Ken Flerlage. Please be advised the pathways may take some additional time to calculate and display on slower machines or devices.
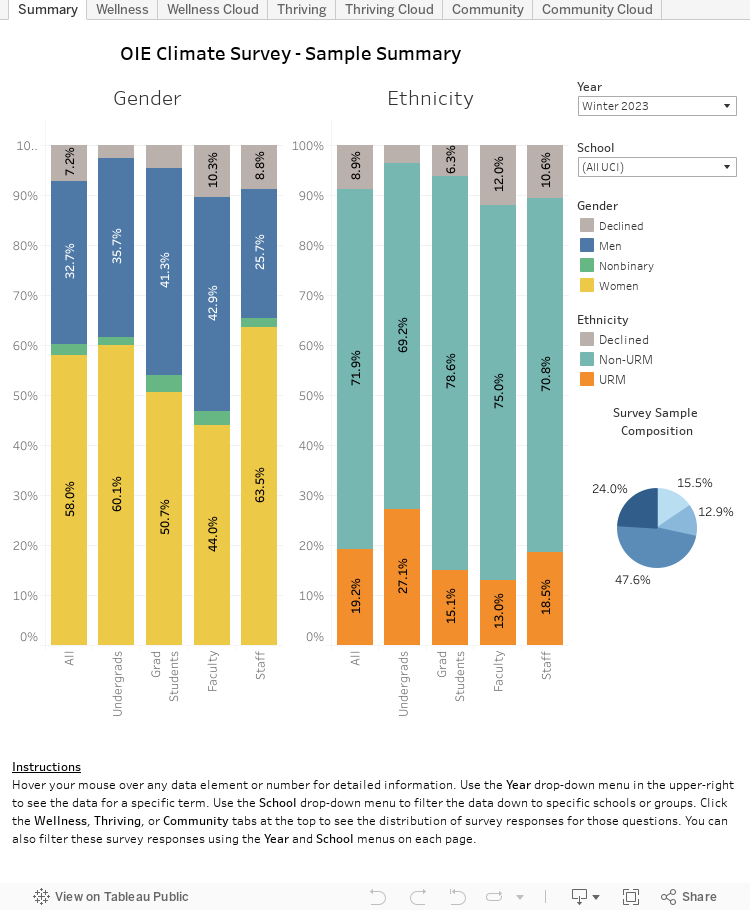
Below is a visualization of the results from the campuswide Climate Survey conducted by OIE. Each year of survey results is presented within the visualization and may be viewed by selecting the appropriate menu option.
These results are particularly focused on how the campus communities perceived the pillars of the OIE Action Plan (Wellness, Thriving, and Community) during any given year.
An explanation of the counting rules for demographic groups is provided below the visualization. A detailed guide for using Tableau can be found here: OIE Tableau Dashboard Guide
Climate Survey tab descriptions are as follows:
Summary: Response rates and demographic distributions for the survey sample.
Wellness: Wellness-related survey questions.
Wellness Cloud: Most frequently-used words from Wellness open-ended questions.
Thriving: Thriving-related survey questions.
Thriving Cloud: Most frequently-used words from Thriving open-ended questions.
Community: Community-related survey questions.
Community Cloud: Most frequently-used words from Community open-ended questions.
Note: This visualization is designed to be viewed from a desktop or laptop computer and may not display properly when viewed from other devices.
Respondents self-identified as one of the following categories: Undergraduates, Graduate Students, Faculty, and Staff. The Graduate Student category includes graduate students as well as professional students and postdoctoral scholars. The Faculty category includes Senate and non-Senate faculty as well as tenured and non-tenured faculty. The Staff category includes individuals from all ranks, including managers and administrators.
Gender: Gender categories were based on a demographic question asking respondents to identify as: women, men, trans women, trans men, gender non-binary/genderqueer/non-conforming, or a choice to decline identification. The Women category includes all respondents identifying as women. The Men category includes all respondents identifying as men. The Transgender/Nonbinary category includes all respondents identifying as transgender, non-binary, genderqueer, and/or non-conforming. The Declined category includes every respondent who declined to answer the question, regardless of their actual gender identity.
URM: Underrepresented minority (URM) status was determined based on a demographic question related to ethnicity. Any individual identifying as any of the following groups was considered URM: American Indian or Alaskan Native, Black or African American, Hispanic or Latino, and Native Hawaiian or Pacific Islander.
All UCI: Because this is an enterprise-wide survey, the All UCI category includes the overall responses from the entire sample (i.e., all respondents from both the main UCI campus and the Medical Center).
Non-Academic: The Non-Academic category primarily consists of staff who completed the survey but did not identify membership with a specific academic school or program. For example, staff members from OIE who completed the survey would be listed in the Non-Academic category. This category likewise includes students and faculty who did not provide identification with a specific school or program.
STEM/Non-STEM: Although definitions of STEM categories vary, we are coinciding with the initial data and template provided to the Association of Public and Land-grant Universities (APLU) in their ongoing process to assist in the development of OIE’s Action Plan. We are also presenting the survey results by Schools rather than by programs. Under these circumstances, STEM refers to the following schools/areas: Biological Sciences, Engineering, ICS, Medicine, Nursing Science, Pharmaceutical Sciences, Physical Sciences, and Public Health. Non-STEM refers to the following schools/areas: Arts, Business, Education, Humanities, Law, Social Ecology, and Social Sciences.
Group: Respondents identified as Undergraduates, Graduate Students, Postdoctoral Scholars, Faculty, Staff, and Other. The "Other" category includes alumni, University Hills residents, and those who declined to provide identification. The Graduate Student category includes graduate students as well as professional students and postdoctoral scholars. The Faculty category includes Senate and non-Senate faculty as well as tenured and non-tenured faculty. The Staff category includes individuals from all ranks, including managers and administrators.
Gender: Gender categories were based on a demographic question asking respondents to identify as: male/man, female/woman, nonbinary/third gender, intersex, or a choice to decline stating their identification. The Nonbinary category includes all respondents identifying as non-binary, third gender, intersex, or another/different open-ended identity. The Declined category includes every respondent who declined to answer the question, regardless of their actual gender identity.
Ethnicity: Underrepresented minority (URM) status was determined based on a demographic question related to ethnicity. Any individual identifying as any of the following groups was considered URM: American Indian or Alaskan Native, Black or African American, Hispanic or Latino, and Native Hawaiian or Pacific Islander.
Interaction with UCIPD: All results in this visualization can be further filtered on the basis of respondents' prior interactions with UCIPD. "Voluntary Only" reflects respondents who have only initiated contact with the UCIPD voluntarily (i.e. have not been stopped by UCIPD). "Involuntary Only" reflects respondents who have only been stopped or approached and questioned by UCIPD (i.e. have never voluntarily initiated contact with UCIPD). "No Interaction" reflects respondents who have had no prior interactions with the UCIPD.
*Information regarding respondents' sexual orientations was collected, but in order to preserve the privacy of groups with small numbers and potentially identifiable members, this information is included in the written report but not incorporated into the interactive visualization.
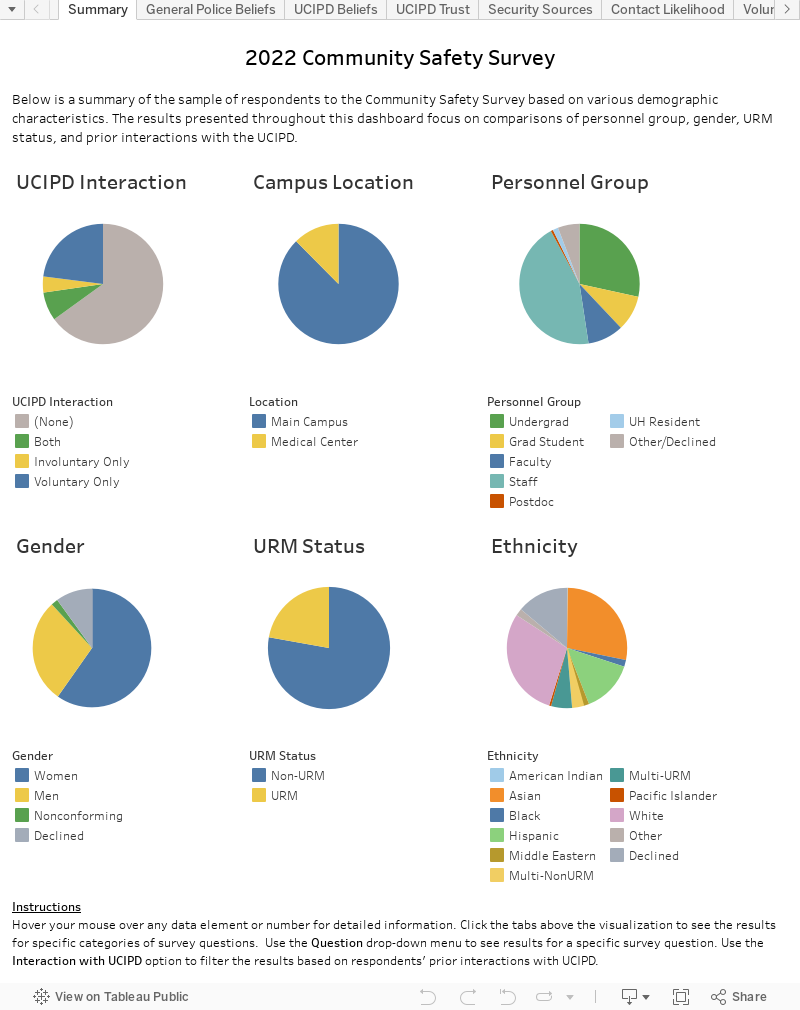
Below is a visualization of the results from the Community Safety Survey conducted by OIE. An explanation of the counting rules for demographic groups is provided below the visualization. A detailed guide for using Tableau can be found here: OIE Tableau Dashboard Guide
The Community Safety Survey tab descriptions are as follows:
Summary: Demographic distributions for the survey sample.
General Police Beliefs: Beliefs about the United States police's decision-making and treatment of others.
UCIPD Beliefs: Beliefs about the UCIPD's decision-making and treatment of others.
UCIPD Trust: Evaluations of trust and confidence in the UCIPD.
Security Sources: Respondents' most popular sources of security and safety at UCI.
Contact Likelihood: Respondents' likelihood of engaging with UCIPD under a variety of hypothetical scenarios.
Voluntary Interaction: Number of times and reasons stated for respondents contacting the UCIPD.
Involuntary Interaction: Number of times and reasons stated for respondents being stopped by the UCIPD.
Other Interaction: Other types of interactions and engagement activities with the UCIPD.
Encounter Treatment: Evaluations of UCIPD behavior during a given encounter.
Post-Encounter Support: Evaluations of support received after a given encounter.
Proposed Strategies: Respondents' endorsement of various community safety reform strategies.
Proposed Responsibilities: Respondents' endorsement of UCIPD's level of responsibility for various circumstances.
Note: This visualization is designed to be viewed from a desktop or laptop computer and may not display properly when viewed from other devices.
Respondents self-identified as one of the following categories: Undergraduates, Graduate Students, Faculty, and Staff. The Graduate Student category includes graduate students as well as professional students and postdoctoral scholars. The Faculty category includes Senate and non-Senate faculty as well as tenured and non-tenured faculty. The Staff category includes individuals from all ranks, including managers and administrators.
Gender: Gender categories were based on a demographic question asking respondents to identify as: women, men, trans women, trans men, gender non-binary/genderqueer/non-conforming, or a choice to decline identification. The Women category includes all respondents identifying as women. The Men category includes all respondents identifying as men. The Transgender/Nonbinary category includes all respondents identifying as transgender, non-binary, genderqueer, and/or non-conforming. The Declined category includes every respondent who declined to answer the question, regardless of their actual gender identity.
URM: Underrepresented minority (URM) status was determined based on a demographic question related to ethnicity. Any individual identifying as any of the following groups was considered URM: American Indian or Alaskan Native, Black or African American, Hispanic or Latino, and Native Hawaiian or Pacific Islander.
All UCI: Because this is an enterprise-wide survey, the All UCI category includes the overall responses from the entire sample (i.e., all respondents from both the main UCI campus and the Medical Center).
Non-Academic: The Non-Academic category primarily consists of staff who completed the survey but did not identify membership with a specific academic school or program. For example, staff members from OIE who completed the survey would be listed in the Non-Academic category. This category likewise includes students and faculty who did not provide identification with a specific school or program.
STEM/Non-STEM: Although definitions of STEM categories vary, we are coinciding with the initial data and template provided to the Association of Public and Land-grant Universities (APLU) in their ongoing process to assist in the development of OIE’s Action Plan. We are also presenting the survey results by Schools rather than by programs. Under these circumstances, STEM refers to the following schools/areas: Biological Sciences, Engineering, ICS, Medicine, Nursing Science, Pharmaceutical Sciences, Physical Sciences, and Public Health. Non-STEM refers to the following schools/areas: Arts, Business, Education, Humanities, Law, Social Ecology, and Social Sciences.
Group: Respondents identified as Undergraduates, Graduate Students, Postdoctoral Scholars, Faculty, Staff, and Other. The "Other" category includes alumni, University Hills residents, and those who declined to provide identification. The Graduate Student category includes graduate students as well as professional students and postdoctoral scholars. The Faculty category includes Senate and non-Senate faculty as well as tenured and non-tenured faculty. The Staff category includes individuals from all ranks, including managers and administrators.
Gender: Gender categories were based on a demographic question asking respondents to identify as: male/man, female/woman, nonbinary/third gender, intersex, or a choice to decline stating their identification. The Nonbinary category includes all respondents identifying as non-binary, third gender, intersex, or another/different open-ended identity. The Declined category includes every respondent who declined to answer the question, regardless of their actual gender identity.
Ethnicity: Underrepresented minority (URM) status was determined based on a demographic question related to ethnicity. Any individual identifying as any of the following groups was considered URM: American Indian or Alaskan Native, Black or African American, Hispanic or Latino, and Native Hawaiian or Pacific Islander.
Interaction with UCIPD: All results in this visualization can be further filtered on the basis of respondents' prior interactions with UCIPD. "Voluntary Only" reflects respondents who have only initiated contact with the UCIPD voluntarily (i.e. have not been stopped by UCIPD). "Involuntary Only" reflects respondents who have only been stopped or approached and questioned by UCIPD (i.e. have never voluntarily initiated contact with UCIPD). "No Interaction" reflects respondents who have had no prior interactions with the UCIPD.
*Information regarding respondents' sexual orientations was collected, but in order to preserve the privacy of groups with small numbers and potentially identifiable members, this information is included in the written report but not incorporated into the interactive visualization.
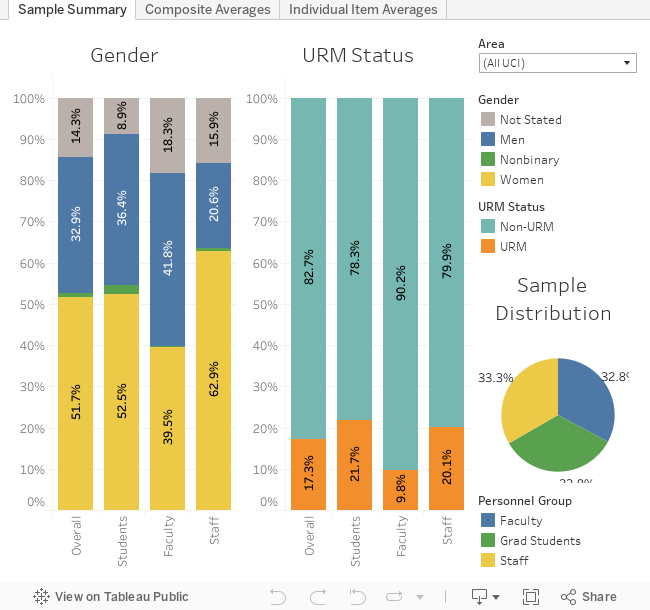
Below is a visualization of the results from the Unit Equity Review conducted by OIE. The Unit Equity Review was administered yearly to graduate students, faculty, and staff in select academic schools from 2019-20 to 2022-23. This survey was originally designed with help from faculty groups (e.g., the Provost Leadership Academy) to identify climate issues and provide a benchmark for assisting leadership in addressing such issues and creating more inclusive environments in their schools. The survey covers a range of topics, including relationships between students, faculty and staff, opinions about the school, and specific beliefs and behaviors related to diversity, equity, and inclusion.
A detailed guide for using Tableau can be found here: OIE Tableau Dashboard Guide
The Sample Summary tab of the visualization provides an overview of respondents who participated in the survey over the years. Selecting the "Area" drop-down menu will open a list of options for reviewing the results by academic year, school groupings (i.e., Health Sciences, STEM, and Non-STEM), or for individual schools.
The Composite Averages tab provides response averages for the survey, disaggregated by personnel group, gender identity, and URM status. Multiple survey items related to the same concept were grouped together into composites presented in this visualization. The "Area" drop-down menu provides a list of respondent groups similar to those seen in the Sample Summary, while the "Question Set" drop-down menu lists each of the composites from the survey. A definition of the selected composite and the measurement scale used throughout the survey are displayed to the right of the visualization. Hovering or placing your cursor over any of the bars in the chart will provide information about the selected group, its average score, and which category this score represents on the scale.
The Individual Item Averages tab provides response averages for the individual items that make up the composites of the survey, disaggregated by personnel group, gender identity, and URM status. In order to maintain confidentiality of the responses and legibility of the visualization, only the aggregate results for the entire UCI sample are presented in this tab. The "Question" drop-down menu provides a list of items used in the survey, with the respective composite noted in parentheses. The full text of the selected item is displayed above the visualization, while the measurement scale is displayed to the right. Hovering or placing your cursor over any of the bars in the chart will provide information about the selected group, its average score, and which category this score represents on the scale.
Note: This visualization is designed to be viewed from a desktop or laptop computer and may not display properly when viewed from other devices.
Respondents self-identified as one of the following categories: Undergraduates, Graduate Students, Faculty, and Staff. The Graduate Student category includes graduate students as well as professional students and postdoctoral scholars. The Faculty category includes Senate and non-Senate faculty as well as tenured and non-tenured faculty. The Staff category includes individuals from all ranks, including managers and administrators.
Gender: Gender categories were based on a demographic question asking respondents to identify as: women, men, trans women, trans men, gender non-binary/genderqueer/non-conforming, or a choice to decline identification. The Women category includes all respondents identifying as women. The Men category includes all respondents identifying as men. The Transgender/Nonbinary category includes all respondents identifying as transgender, non-binary, genderqueer, and/or non-conforming. The Declined category includes every respondent who declined to answer the question, regardless of their actual gender identity.
URM: Underrepresented minority (URM) status was determined based on a demographic question related to ethnicity. Any individual identifying as any of the following groups was considered URM: American Indian or Alaskan Native, Black or African American, Hispanic or Latino, and Native Hawaiian or Pacific Islander.
All UCI: Because this is an enterprise-wide survey, the All UCI category includes the overall responses from the entire sample (i.e., all respondents from both the main UCI campus and the Medical Center).
Non-Academic: The Non-Academic category primarily consists of staff who completed the survey but did not identify membership with a specific academic school or program. For example, staff members from OIE who completed the survey would be listed in the Non-Academic category. This category likewise includes students and faculty who did not provide identification with a specific school or program.
STEM/Non-STEM: Although definitions of STEM categories vary, we are coinciding with the initial data and template provided to the Association of Public and Land-grant Universities (APLU) in their ongoing process to assist in the development of OIE’s Action Plan. We are also presenting the survey results by Schools rather than by programs. Under these circumstances, STEM refers to the following schools/areas: Biological Sciences, Engineering, ICS, Medicine, Nursing Science, Pharmaceutical Sciences, Physical Sciences, and Public Health. Non-STEM refers to the following schools/areas: Arts, Business, Education, Humanities, Law, Social Ecology, and Social Sciences.
Group: Respondents identified as Undergraduates, Graduate Students, Postdoctoral Scholars, Faculty, Staff, and Other. The "Other" category includes alumni, University Hills residents, and those who declined to provide identification. The Graduate Student category includes graduate students as well as professional students and postdoctoral scholars. The Faculty category includes Senate and non-Senate faculty as well as tenured and non-tenured faculty. The Staff category includes individuals from all ranks, including managers and administrators.
Gender: Gender categories were based on a demographic question asking respondents to identify as: male/man, female/woman, nonbinary/third gender, intersex, or a choice to decline stating their identification. The Nonbinary category includes all respondents identifying as non-binary, third gender, intersex, or another/different open-ended identity. The Declined category includes every respondent who declined to answer the question, regardless of their actual gender identity.
Ethnicity: Underrepresented minority (URM) status was determined based on a demographic question related to ethnicity. Any individual identifying as any of the following groups was considered URM: American Indian or Alaskan Native, Black or African American, Hispanic or Latino, and Native Hawaiian or Pacific Islander.
Interaction with UCIPD: All results in this visualization can be further filtered on the basis of respondents' prior interactions with UCIPD. "Voluntary Only" reflects respondents who have only initiated contact with the UCIPD voluntarily (i.e. have not been stopped by UCIPD). "Involuntary Only" reflects respondents who have only been stopped or approached and questioned by UCIPD (i.e. have never voluntarily initiated contact with UCIPD). "No Interaction" reflects respondents who have had no prior interactions with the UCIPD.
*Information regarding respondents' sexual orientations was collected, but in order to preserve the privacy of groups with small numbers and potentially identifiable members, this information is included in the written report but not incorporated into the interactive visualization.